For multivariate time series data , the page for Visualization of entire data with R shows how to make all variables into a line graph and view them all at once.
As an application of this method, this page is a method of converting the data into a line graph and observing the changes over time while revealing the characteristics of the data.
There are three types of conversion methods: principal component analysis (PCA), independent component analysis (ICA), and factor analysis (FA).
In the code below, you can select the conversion type by changing the number on the first line. If you change the number on the second line, the shape of the graph will change and the appearance of the result will change.
The ICA and FA run PCA as a pre-process to estimate the number of variables sufficient to explain.
The rotation of FA is set to varimax.
Dimension_reduction_type <- 1 # Method selection 1 = No conversion, 2 = PCA, 3 = ICA, 4 = FA
Line_graph <-1 # Graph shape selection 1 = One graph, 2 = Split graph
library(ggplot2)
library(tidyr)
library(fastICA)
library(psych)
library(GPArotation)
setwd("C:/Rtest")
Data <- read.csv("Data.csv", header=T)
if(Dimension_reduction_type == 1){
Data2 <- Data
} else if(Dimension_reduction_type == 2){
pc <- prcomp(Data, scale=TRUE,tol=0.01)
Data2 <- as.data.frame(pc$x)
summary(pc)
} else if(Dimension_reduction_type == 3){
pc <- prcomp(Data, scale=TRUE, tol=0.01)
ic <- fastICA(Data, ncol(pc$x))
Data2 <- as.data.frame(ic$S)
summary(ic)
} else if(Dimension_reduction_type == 4){
pc <- prcomp(Data, scale=TRUE, tol=0.01)
fa_result <- fa(Data, nfactors = ncol(pc$x), fm = "ml", rotate = "varimax")
Data2 <- as.data.frame(fa_result$scores)
fa_result$loadings
}
Data2$No <-as.numeric(row.names(Data2))
Data_long <- tidyr::gather(Data2, key="Yno", value = Ys, -No)
if(Line_graph == 1){
gplot <- ggplot(Data_long, aes(x=No,y=Ys, colour=Yno)) + geom_line()
} else {
gplot <- ggplot(Data_long, aes(x=No,y=Ys)) + geom_line() + facet_wrap(~Yno,scales="free")
}
gplot
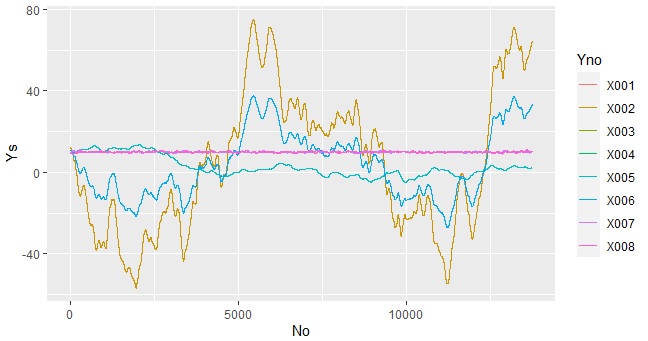
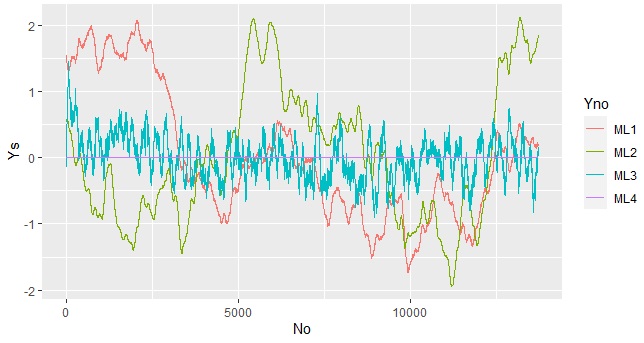
The figure above is the original data that is not converted with "Dimension_reduction_type <-1". The figure below shows the case where FA is selected with "Dimension_reduction_type <-4".
